When reviewing DISC assessment graphs, it is interesting to observe that more than 70% of Fortune 500 companies utilize these tools for employee growth and team building objectives. Delving into the intricate details and patterns displayed in these graphs can provide deep insights into our behavioral tendencies and interpersonal relationships.
By unraveling the complexities behind each graph, we can gain a deeper understanding of ourselves and others, leading to enhanced communication, collaboration, and personal growth. So, what exactly do these graphs reveal about our behavior? Let's explore the hidden depths together.
Key Takeaways
- DISC graphs uncover behavior through masks, cores, and mirrors.
- High and low intensity traits highlight strengths and growth areas.
- Shift patterns in graphs reveal energy levels and behavioral tendencies.
- Workplace applications include enhancing communication and leadership strategies.
Graph Patterns and Meanings
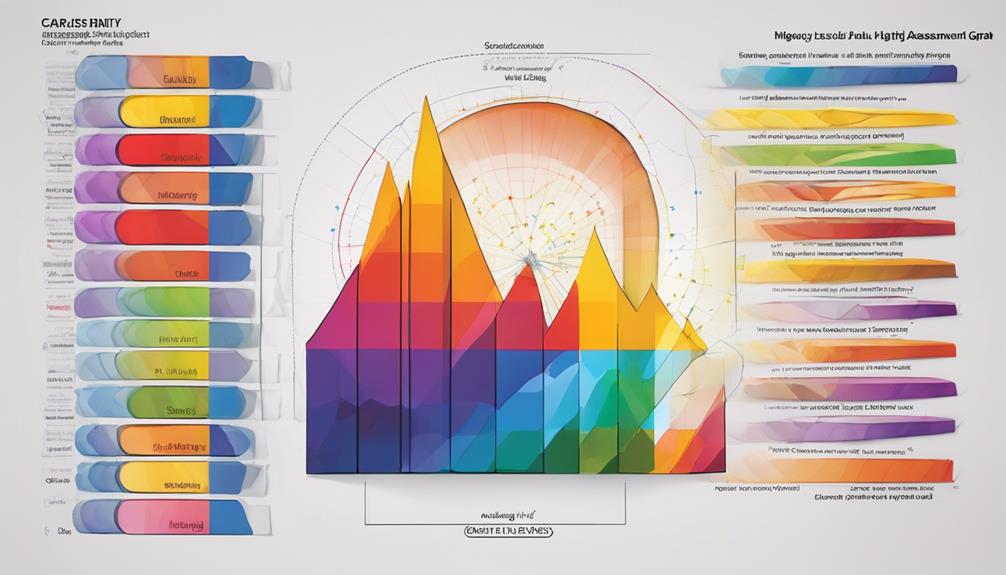
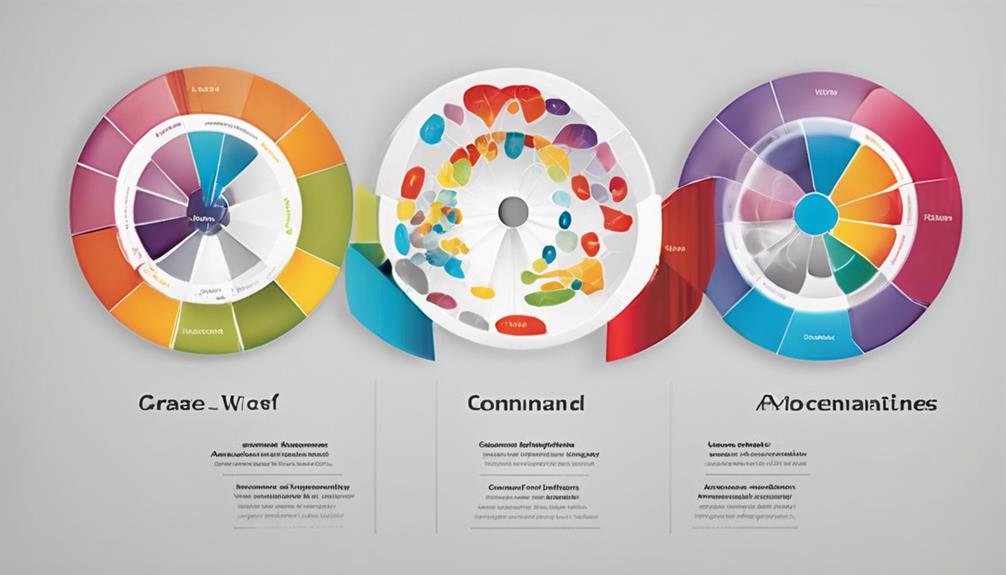
When analyzing DISC assessment graphs, understanding the distinct components – The Mask, The Core, and The Mirror – is crucial to interpreting behavior patterns accurately.
The Mask, depicted in Graph 1, shows how one believes they should behave, often influenced by social norms or expectations. This may not always align with the Core behavior showcased in Graph 2, which represents one's instinctual responses under stress, revealing a more authentic self.
The Mirror, an average of Graphs 1 and 2, offers insight into natural behavior tendencies across various situations. Recognizing discrepancies between these graphs can help individuals manage stress better by understanding their true responses versus perceived ones.
Moreover, identifying consistent patterns within the graphs can guide personal growth strategies, enabling individuals to enhance their strengths and address areas for development effectively. By delving into these graph patterns and meanings, individuals can gain valuable insights into their behavior and pave the way for positive transformations.
Interpreting High Intensity Traits

Analyzing high intensity traits in DISC assessment graphs reveals potential strengths that, when overused, can transform into weaknesses impacting behavior significantly. When interpreting these traits, it's crucial to understand the implications of an imbalance in dominant (D), influential (I), steady (S), or conscientious (C) traits.
Here are key points to consider:
- High intensity traits indicate strengths that are being overly relied upon, potentially leading to weaknesses.
- Overusing dominant traits (D) can result in being overly controlling or aggressive.
- Excessive influential traits (I) may manifest as attention-seeking behavior or impulsiveness.
- Steady traits (S) when overemphasized might lead to indecisiveness or resistance to change.
- Overusing conscientious traits (C) can result in perfectionism or micromanaging tendencies.
Identifying Low Intensity Traits
In identifying low intensity traits within DISC assessment graphs, individuals can gain valuable insights into areas where assertiveness and confidence may be lacking. Low intensity traits such as confrontation avoidance, a preference for risk aversion, and difficulties in decision-making can significantly impact one's social interactions and communication styles.
These traits may manifest in a tendency to shy away from challenging situations, leading to missed opportunities for growth and development. Individuals exhibiting low intensity traits might struggle with asserting themselves in group settings, making it challenging to take on leadership roles or navigate conflicts effectively.
Understanding Shift Patterns

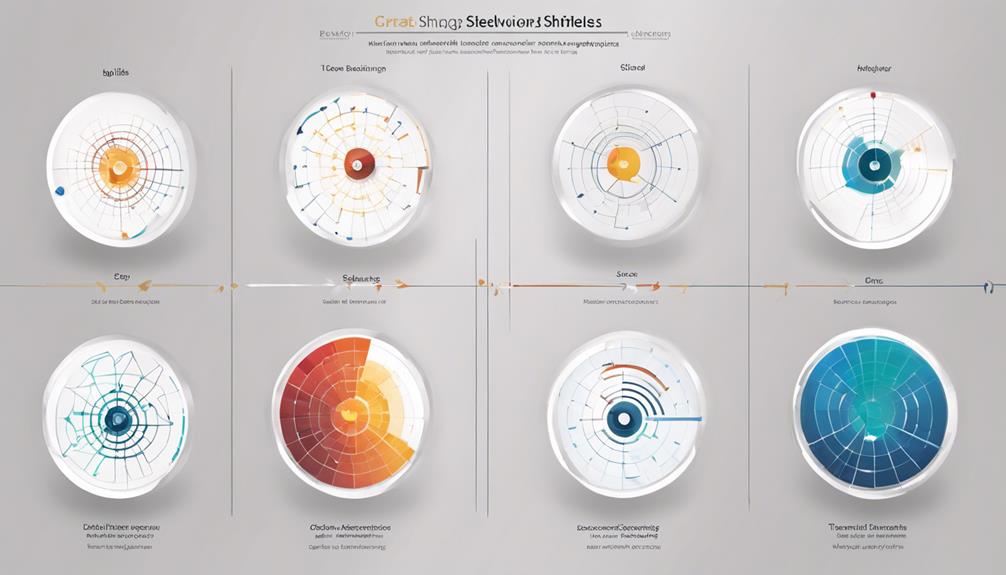
Understanding the shift patterns present in DISC assessment graphs offers a valuable lens through which to decipher behavioral inclinations and pinpoint areas ripe for personal development or adjustment. When analyzing these patterns, it's crucial to consider the following insights:
- Over Shift Pattern: Indicates high intensity across all DISC styles, suggesting potential high-achievers at risk of burnout due to intense energy expenditure.
- Under Shift Pattern: Reflects low energy exertion, which may point to self-doubt or lack of confidence, serving as a caution for potential under-achievers.
- Transition or Chameleon Pattern: Occurs temporarily during life events like job changes, where individuals adapt to blend with different DISC styles, highlighting the need for reassessment post-settlement in a new environment.
- Identifying Behavioral Tendencies: Shift patterns help in identifying behavioral tendencies that can guide personal development and adjustment.
- Guidance for Coaches and Consultants: These patterns provide valuable insights for coaches and consultants in supporting individuals towards behavioral adaptation and growth.
Applying Graph Insights at Work
Shifting focus to the practical application of DISC assessment graphs in professional settings reveals opportunities to enhance communication strategies and leadership approaches tailored to individual personality traits. By leveraging insights gained from these graphs, we can customize communication styles to better suit the preferences of team members, thus fostering more effective interactions. Understanding the nuances of leadership styles through the lens of DISC graphs enables managers to adapt their approaches to resonate with the diverse traits present within their teams. Moreover, utilizing graph insights can guide the provision of targeted training and development opportunities, addressing specific areas for improvement based on individual traits.
Team building efforts can be significantly bolstered by leveraging DISC assessment graphs to create well-rounded teams that capitalize on the strengths of various personality types. Additionally, the deep understanding of individual trait tendencies provided by these graphs can greatly enhance conflict resolution and decision-making processes in the workplace. Ultimately, applying graph insights at work leads to improved team dynamics, enhanced communication, and more effective interpersonal relationships within the organization.
Frequently Asked Questions
How Do You Interpret DISC Results?
We interpret DISC results by analyzing graphs for expected behavior, stress responses, and self-perception. Variations reveal insights into stress, growth, or needed adaptations. Comparing Dominance, Influence, Steadiness, and Conscientiousness in Graphs 1 and 2 identifies dominant styles. Graph 3 predicts behavior and stress areas.
What Are the Four Personality Traits From the DISC Behavioral Model?
We identify D, I, S, and C as the four personality traits in the DISC model. D represents dominance, I stands for influence, S signifies steadiness, and C denotes conscientiousness. Understanding these traits enhances behavioral awareness.
What Is the DISC Behavior Analysis?
DISC behavior analysis involves interpreting assessment graphs to unveil behavioral tendencies. Understanding these graphs aids in identifying stress triggers, growth areas, and dominant styles. Coaches utilize this insight to facilitate personal development and enhance relationships effectively.
How Do You Read a DISC Assessment Graph?
Reading a DISC assessment graph involves analyzing The Mask, The Core, and The Mirror graphs. The Mask reflects perceived behavior, The Core shows instinctual responses, and The Mirror combines both. Understanding these aids in behavior management and personal growth.
How Can DISC Assessment Graphs Help Identify Behavior Patterns for Personal Growth?
The DISC Assessment catalyst provides valuable insight into behavior patterns, enabling individuals to better understand their strengths and weaknesses. By analyzing the graphs generated by the assessment, one can identify recurring trends and use this information to make positive changes for personal growth.
Conclusion
In conclusion, the DISC assessment graphs serve as a mirror reflecting our behavioral tendencies and responses to stress.
Just as a sculptor hones their craft by chiseling away at imperfections, we too can shape and mold our behavior for personal growth.
By understanding the patterns and intensities revealed in these graphs, we can unlock our true potential and navigate the complexities of relationships and work dynamics with clarity and confidence.


